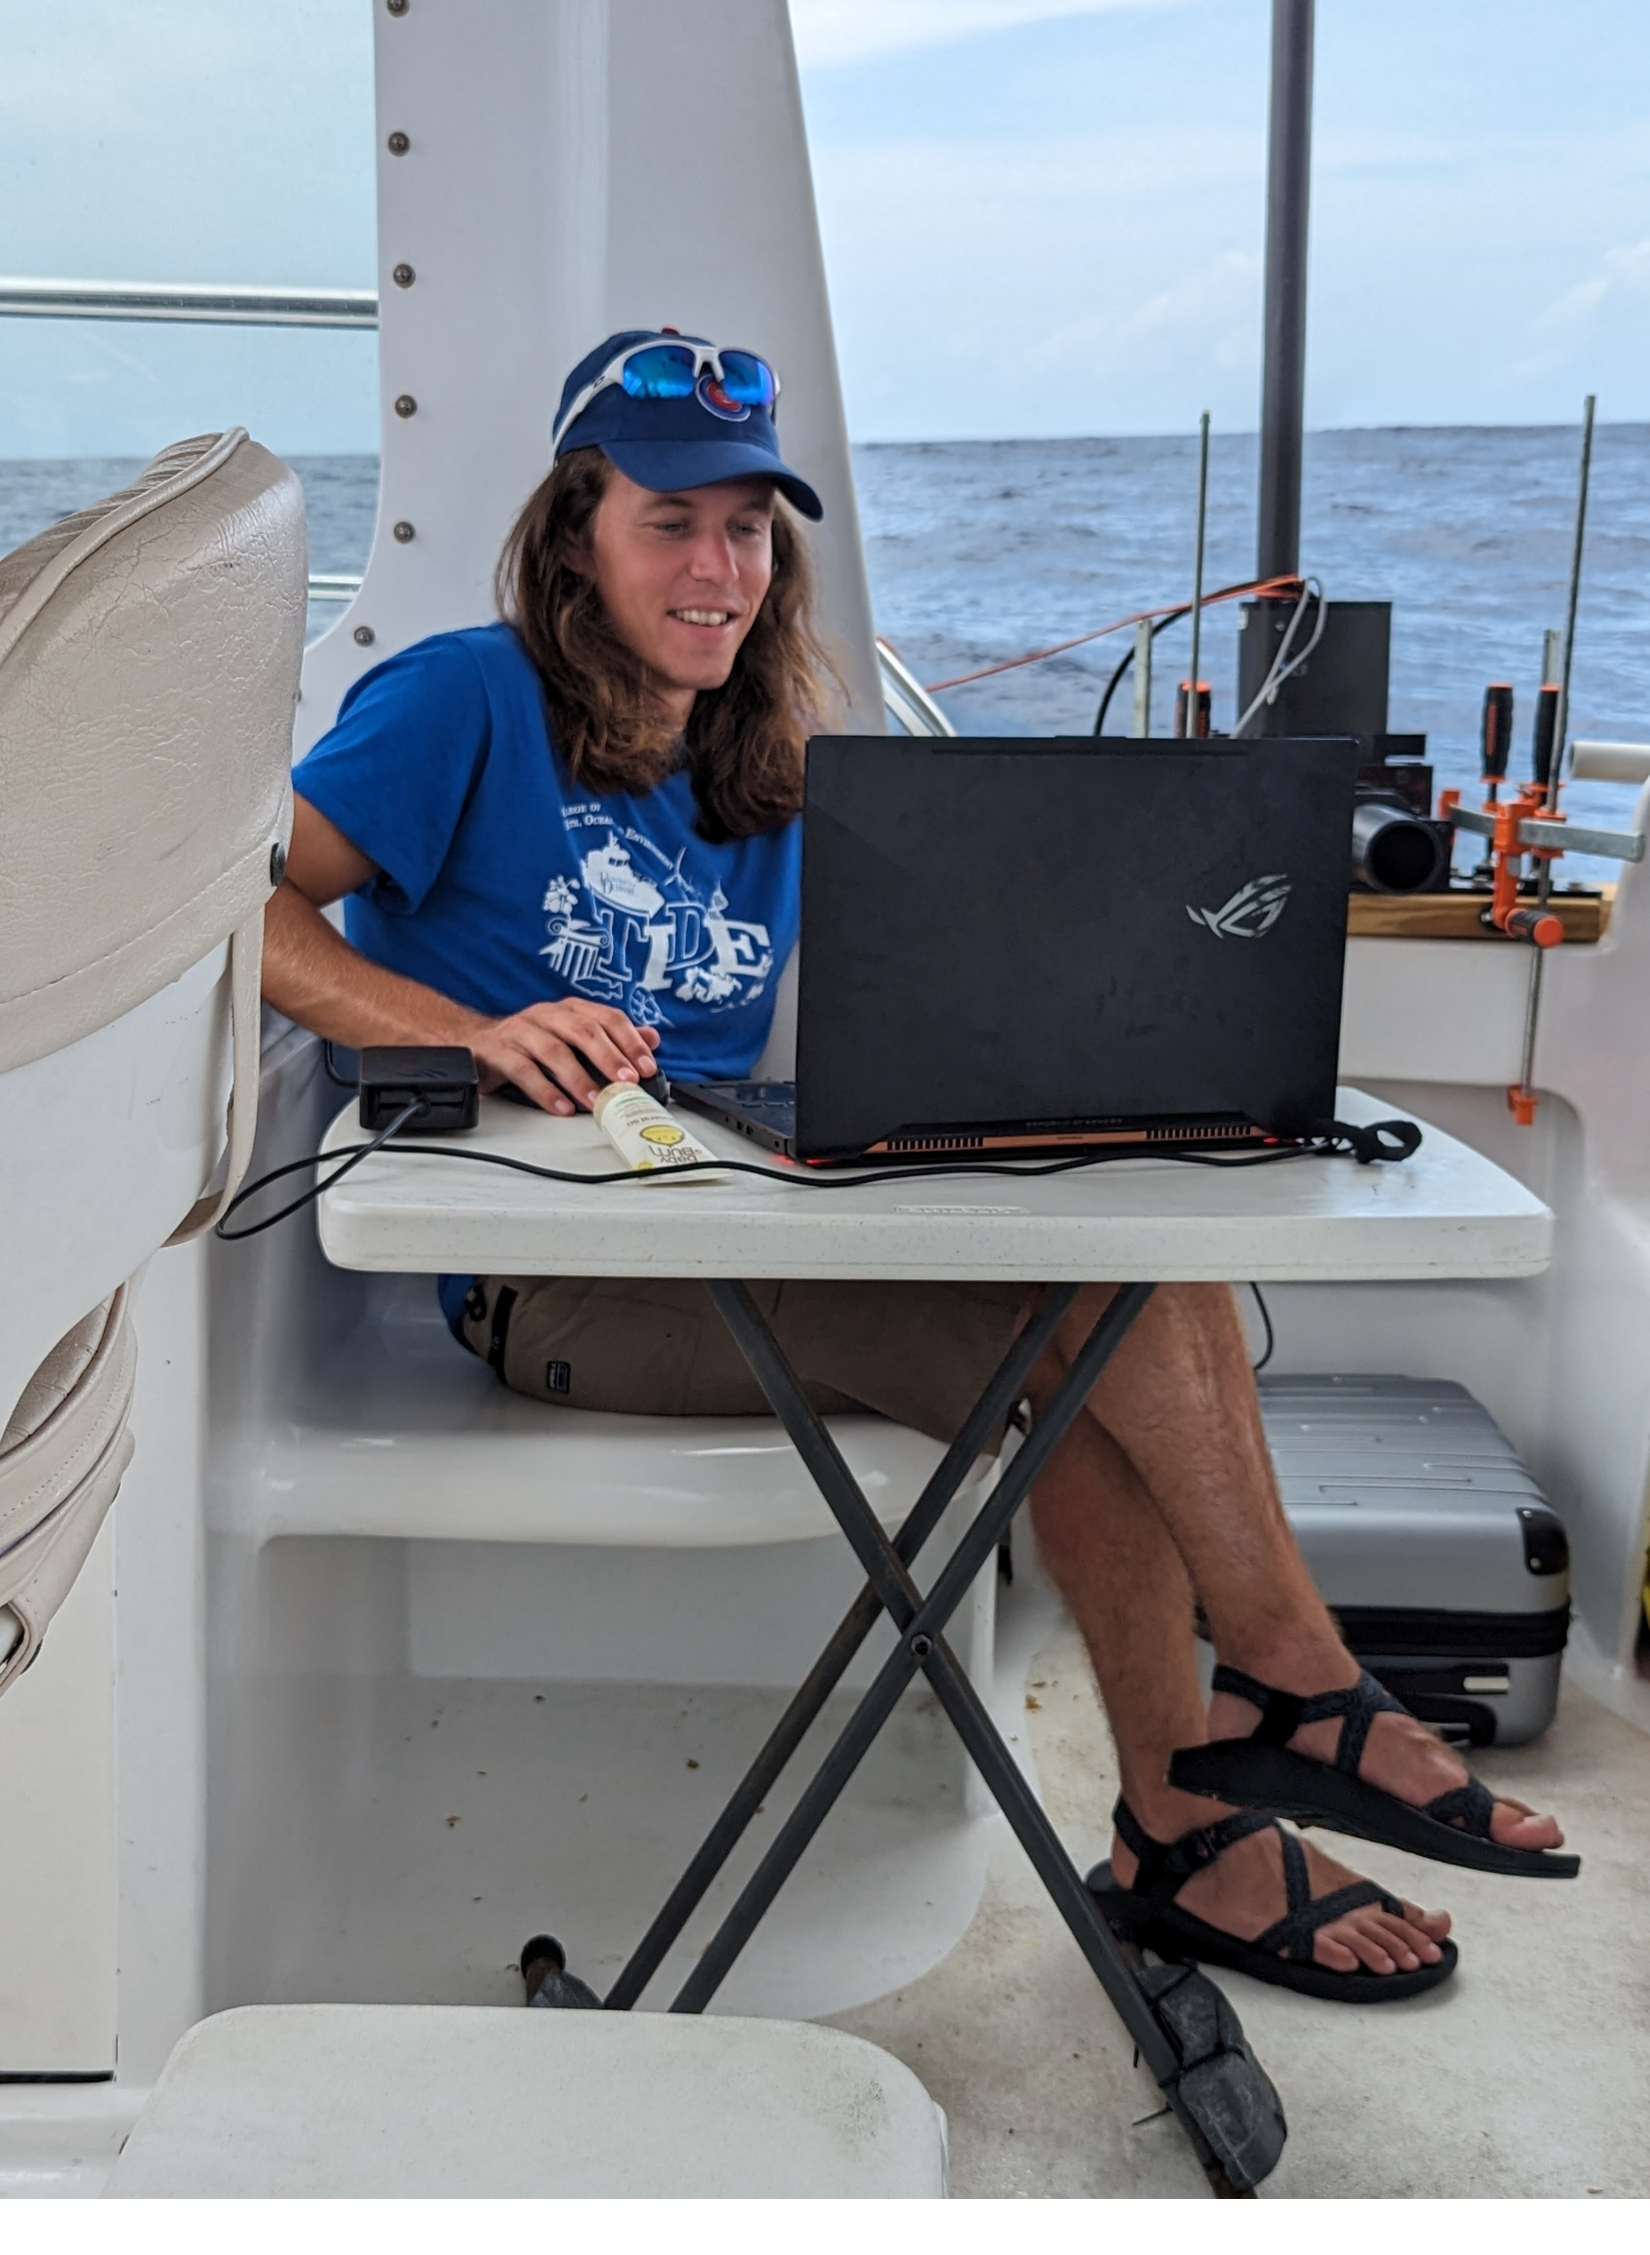
Mark Lundine
Oceanographer, Data Scientist

About
Hello from my new website! I am currently working as a postdoctoral researcher with the US Geological Survey, at the Pacific Coastal Marine Science Center in Santa Cruz, California. My current research interests revolve around using satellite imagery to quantify and possibly predict coastal change. This involves building and implementing machine learning models for image classification, image segmentation, and timeseries prediction.
This work is challenging, rewarding, and important. We need to better understand coastal change to correctly prepare for hazards associated with storms and sea-level rise.
Email: mlundine@usgs.gov Education- PhD, Oceanography, University of Delaware, 2018-2023
- BA, Geology and Applied Mathematics, Augustana College, 2014-2018
- Research Oceanographer, US Geological Survey, 2024-Present
- Postdoctoral Researcher, University of Delaware, 2023-2024
- Unidel Graduate Fellow, University of Delaware, 2018-2023
Research
I was lucky to get integrated into the team at USGS developing CoastSeg. This is an application that allows users to apply various ML models to satellite imagery and quantify coastal change in a reproducible manner. The software is written in Python, is open-source, and collaboration/contribution is highly encouraged! Most of my work so far has been related to another project SDS Tools. Some of my current work revolves around:
- Extending this sort of work to novel areas like Alaska.
- Standardizing ways to analyze the timeseries datasets we can obtain from satellite-derived shorelines.
- Improving segmentation methods and filtering methods for satellite derived shorelines.
- Exploring the limits of ML for shoreline forecasting.
- Data Driven Applications in Coastal Geomorphology (dissertation).
- Detecting and characterizing Carolina Bays.
- Detecting and characterizing pockmarks.
- Using GANs to measure shoreline change from satellite imagery.
- Optimizing UAS methods for coastal surveys.
- Various projects in the field. See an example here or here.
- Satellite Imagery 2-Class (Land and Water)
- Pockmark bounding box detection and segmentation
- Carolina Bays
Currently this page just has some visuals and interactive maps on shoreline change and Carolina Bays I made during my graduate work.
Ok so here is the map with all of the Carolina Bay detections. There are extra layers you can toggle on to see how these features relate to other aspects of quaternary geology. There are a lot of features to display so beware this might be difficult to render.
These interactive maps display linear shoreline trends at cross-shore transects every 200 m along the Long Island, New Jersey Shore, Delmarva, North Carolina, South Carolina, and Northern Tuscany coast. Shorelines were extracted from Landsat 5, 7, 8, and Sentinel-2 satellite imagery. Cross-shore position timeseries were computed at each transect, after which a yearly running mean was applied to each timeseries before computation of the linear trend. Individual transect timeseries can be examined by clicking on a transect, scrolling to the bottom of its attributes, and then clicking on the timeseries image link. This will open a new browser window with the timeseries image. Raw timeseries data (with cross-shore position, timestamp, northings, and eastings) is downloadable as the first csv in the attribute table. The timestamped yearly mean csv is the second listed csv.
Data from Long Island, New Jersey, Delmarva, and Northern Tuscany were extracted using a generative adversarial network whereas data from North Carolina and South Carolina were compiled and made publicly available by the United States Geological Survey in a larger data release.
